CANPL Easterns 2026
Power BI scouting report case study
An independent competition scouting report that turns historical lifting data into a concise preview of the 2026 CANPL Eastern Powerlifting Championships.
- Project type
- Independent analysis
- Audience
- Athletes and coaches
- Tools
- Power BI, DAX, R
- Published
- Instagram, 2026
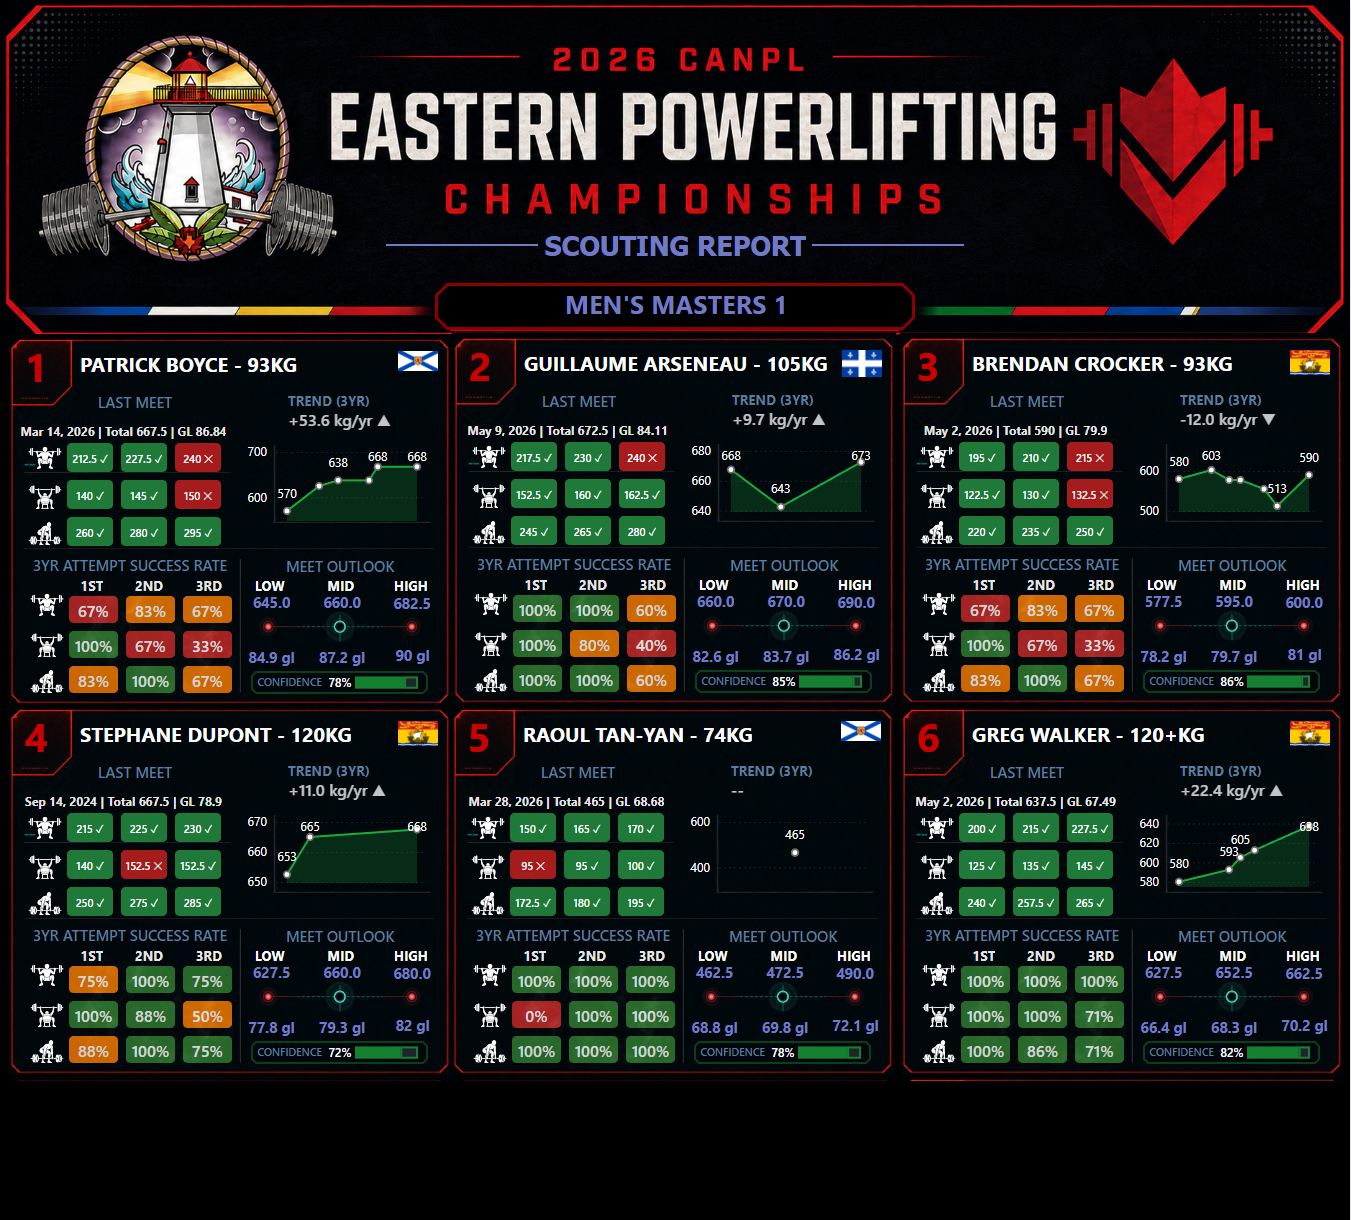
Men’s Masters 1 scouting report. Select the image to open the full-resolution dashboard.
The challenge
A meet roster tells athletes who is competing, but it does not show how those lifters have performed over time or how competitive a class may be. I wanted to give lifters and coaches a quick, evidence-based way to understand the field before Easterns without asking them to work through raw historical results.
The design therefore had to answer several questions at once: Who are the leading athletes in the class? What did each athlete do at their most recent meet? Are their totals trending up or down? How consistently do they make first, second, and third attempts? What range of outcomes is plausible on meet day?
Data and analytical approach
I combined the 2026 competition roster with lifter histories from OpenPowerlifting, resolving names and roster identities before building the report model. An R workflow prepared the athlete-level history, generated low, midpoint, and high total forecasts, and back-tested the forecast approach. Those outputs were then loaded into Power BI alongside the roster and attempt history.
Inside Power BI, DAX measures select each athlete’s latest meet, calculate attempt-level success rates, rank lifters within their class, and format the report’s labels and conditional colours. Three-year total trends provide direction and rate of change, while the forecast range and confidence indicator keep the projection visible without presenting a single estimate as certain.
Dashboard decisions
The six-athlete grid uses a repeated visual grammar so viewers can scan across competitors without relearning the layout. Green, amber, and red communicate made attempts and historical reliability; blue is reserved for projections and supporting context. This keeps a dense report readable at Instagram carousel size while preserving enough detail for coaches who want to study the numbers.
Outcome
The finished scouting report was shared directly with the athlete and coach audience on Instagram as an independent project. It demonstrates an end-to-end workflow: assembling competition data, preparing and validating analytical outputs, translating the model into DAX measures, and packaging the result as a polished public-facing report.
View the original CANPL Easterns post on Instagram
Related project: Explore the Nova Scotia Powerlifting Provincials 2026 class preview.